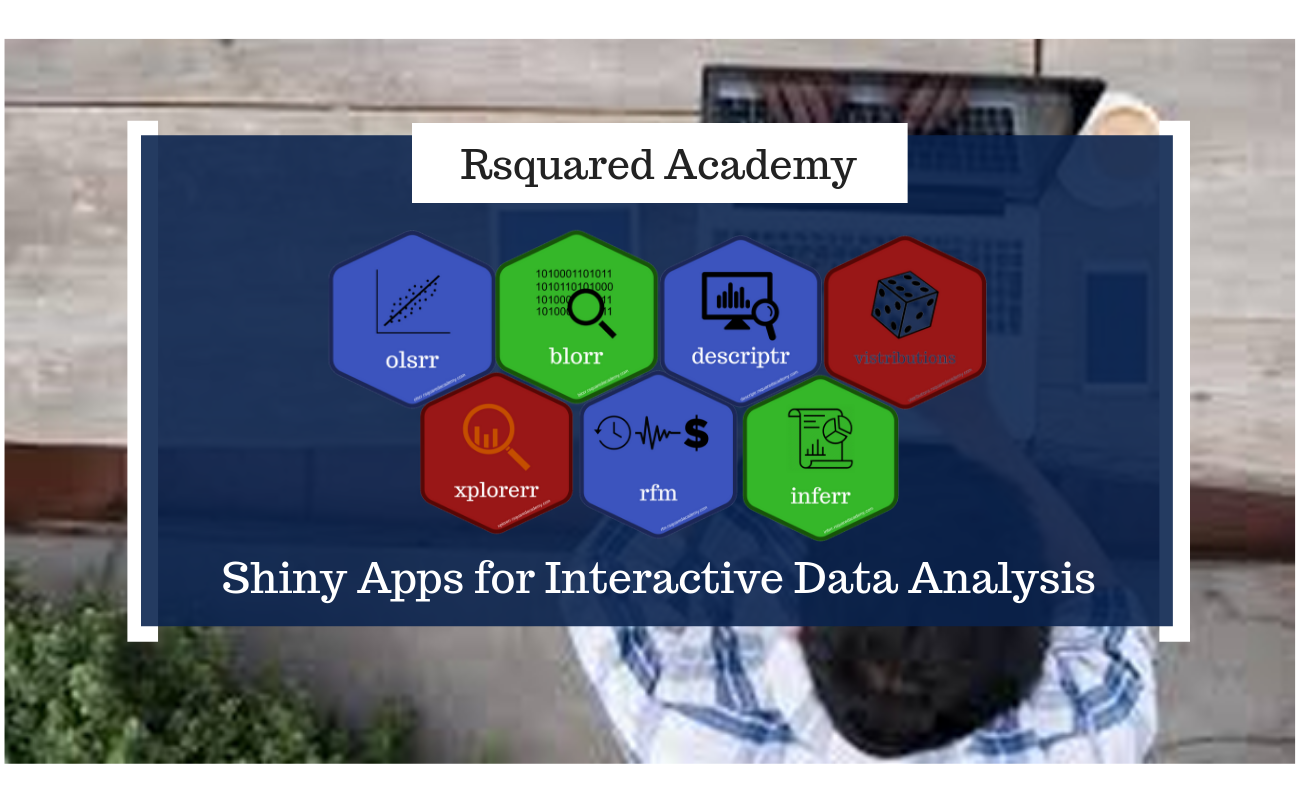
I am excited and happy to share a set of shiny apps built for interactive data analysis and teaching at Rsquared Academy. The apps are part of our R packages and presently cover the following topics:
- Descriptive Statistics
- Probability Distributions
- Hypothesis Testing
- Linear Regression
- Logistic Regression
- RFM Analysis
- Data Visualization
Demo
Details
You can try the live version of the apps here or locally launch these apps from the R packages mentioned in the below table. It will be easier to use the apps if you refer to the documentation of the respective packages.
| Topic | Try App | R Package | API |
|---|---|---|---|
| Descriptive Statistics | Launch | descritpr | ds_launch_shiny_app() |
| Visualize Distributions | Launch | vistributions | vdist_launch_app() |
| Hypothesis Testing | Launch | inferr | infer_launch_shiny_app() |
| Linear Regression | Launch | olsrr | ols_launch_app() |
| Logistic Regression | Launch | blorr | blr_launch_app() |
| RFM Analysis | Launch | rfm | rfm_launch_app() |
| Data Visualization | Launch | xplorerr | app_visualizer() |
Feedback
All feedback is welcome. Issues (bugs and feature requests) can be posted to github tracker. For help with code or other related questions, feel free to reach out to us at pkgs@rsquaredacademy.com.