install.packages("rfm")rfm 0.2.2
packages
The newest release of rfm includes improved docs, bug fixes and much more.
We’re excited to announce the release of rfm 0.2.2 on CRAN! rfm provides tools for customer segmentation using Recency Frequency Monetary value analysis. It includes a Shiny app for interactive segmentation. You can install rfm with:
Note
This post describes rfm 0.2.2 as released in 2020. Since then the rfm_table_*() family was renamed to rfm_*_from_data() (rfm 0.3.0), so the chunks written against the old API are no longer re-executed. Their outputs below are preserved from the original 2020 rendering; the pure dplyr chunks still run against the current sample data.
In this blog post, we will summarize the changes implemented in the current (0.2.2) and previous release (0.2.1).
Segmentation
In previous versions, rfm_segment() would overwrite a segment if the intervals used to define the segment was a subset of another segment. It was expected that the end user would be careful to ensure that the intervals for each segment would be unique and not a subset of any other segment. You can see the example here.
We are grateful to @leungi for bringing this to our attention and also for fixing it. Now, rfm_segment() does not overwrite the segments even if the intervals for one segment is a subset of another.
# analysis date
analysis_date <- lubridate::as_date("2006-12-31")

# rfm score
rfm_result <- rfm_table_order(rfm_data_orders, customer_id, order_date,
                              revenue, analysis_date)

rfm_result

# segmentation
segment_names <- c(
  "Champions", "Loyal Customers", "Potential Loyalist",
  "New Customers", "Promising", "Need Attention", "About To Sleep",
  "At Risk", "Can't Lose Them", "Lost"
)

recency_lower <- c(4, 2, 3, 4, 3, 2, 2, 1, 1, 1)
recency_upper <- c(5, 5, 5, 5, 4, 3, 3, 2, 1, 2)
frequency_lower <- c(4, 3, 1, 1, 1, 2, 1, 2, 4, 1)
frequency_upper <- c(5, 5, 3, 1, 1, 3, 2, 5, 5, 2)
monetary_lower <- c(4, 3, 1, 1, 1, 2, 1, 2, 4, 1)
monetary_upper <- c(5, 5, 3, 1, 1, 3, 2, 5, 5, 2)

segments <-
  rfm_segment(
    rfm_result,
    segment_names,
    recency_lower,
    recency_upper,
    frequency_lower,
    frequency_upper,
    monetary_lower,
    monetary_upper
  )

# segment size
segments %>%
  count(segment) %>%
  arrange(desc(n)) %>%
  rename(Segment = segment, Count = n)
Output of rfm_result:
# A tibble: 995 x 9
   customer_id date_most_recent recency_days transaction_cou~ amount
   <chr>       <date>                  <dbl>            <dbl>  <dbl>
 1 Abbey O'Re~ 2006-06-09                205                6    472
 2 Add Senger  2006-08-13                140                3    340
 3 Aden Lesch~ 2006-06-20                194                4    405
 4 Admiral Se~ 2006-08-21                132                5    448
 5 Agness O'K~ 2006-10-02                 90                9    843
 6 Aileen Bar~ 2006-10-08                 84                9    763
 7 Ailene Her~ 2006-03-25                281                8    699
 8 Aiyanna Br~ 2006-04-29                246                4    157
 9 Ala Schmid~ 2006-01-16                349                3    363
10 Alannah Bo~ 2005-04-21                619                4    196
# ... with 985 more rows, and 4 more variables: recency_score <int>,
#   frequency_score <int>, monetary_score <int>, rfm_score <dbl>
Segment sizes:
# A tibble: 8 x 2
  Segment            Count
  <chr>              <int>
1 Loyal Customers      278
2 Potential Loyalist   229
3 Champions            158
4 Lost                 111
5 At Risk               86
6 About To Sleep        50
7 Others                48
8 Need Attention       35
In the above example, the interval used to define the Champions segment is a subset of Loyal Customers. In the previous versions, those customers who should have been assigned Champions were reassigned as Loyal Customers if the criteria for Champions was evaluated before Loyal Customers. From version 0.2.0, rfm_segment() will avoid such overwriting.
Visualization
rfm used print all the plots by default instead of returning a plot object. This resulted in difficulties for some end users who wanted to:
- further modify the plot
- include the plot in a panel of other plots
From version 0.2.1, all plotting functions use an additional argument print_plot. It is set to TRUE by default to avoid any disruption to current work flows. Those users who want a plot object to be returned can set the above argument to FALSE.
# analysis date
analysis_date <- lubridate::as_date('2007-01-01')

# transactions data
rfm_order <- rfm_table_order(rfm_data_orders, customer_id, order_date,
                             revenue, analysis_date)

# customer data
rfm_customer <- rfm_table_customer(rfm_data_customer, customer_id,
                                   number_of_orders, recency_days, revenue,
                                   analysis_date)

# plots
p1 <-
  rfm_heatmap(rfm_order,
              plot_title = "Transaction Data",
              print_plot = FALSE)

p2 <-
  rfm_heatmap(rfm_customer,
              plot_title = "Customer Data",
              print_plot = FALSE)

# using patchwork
p1 + p2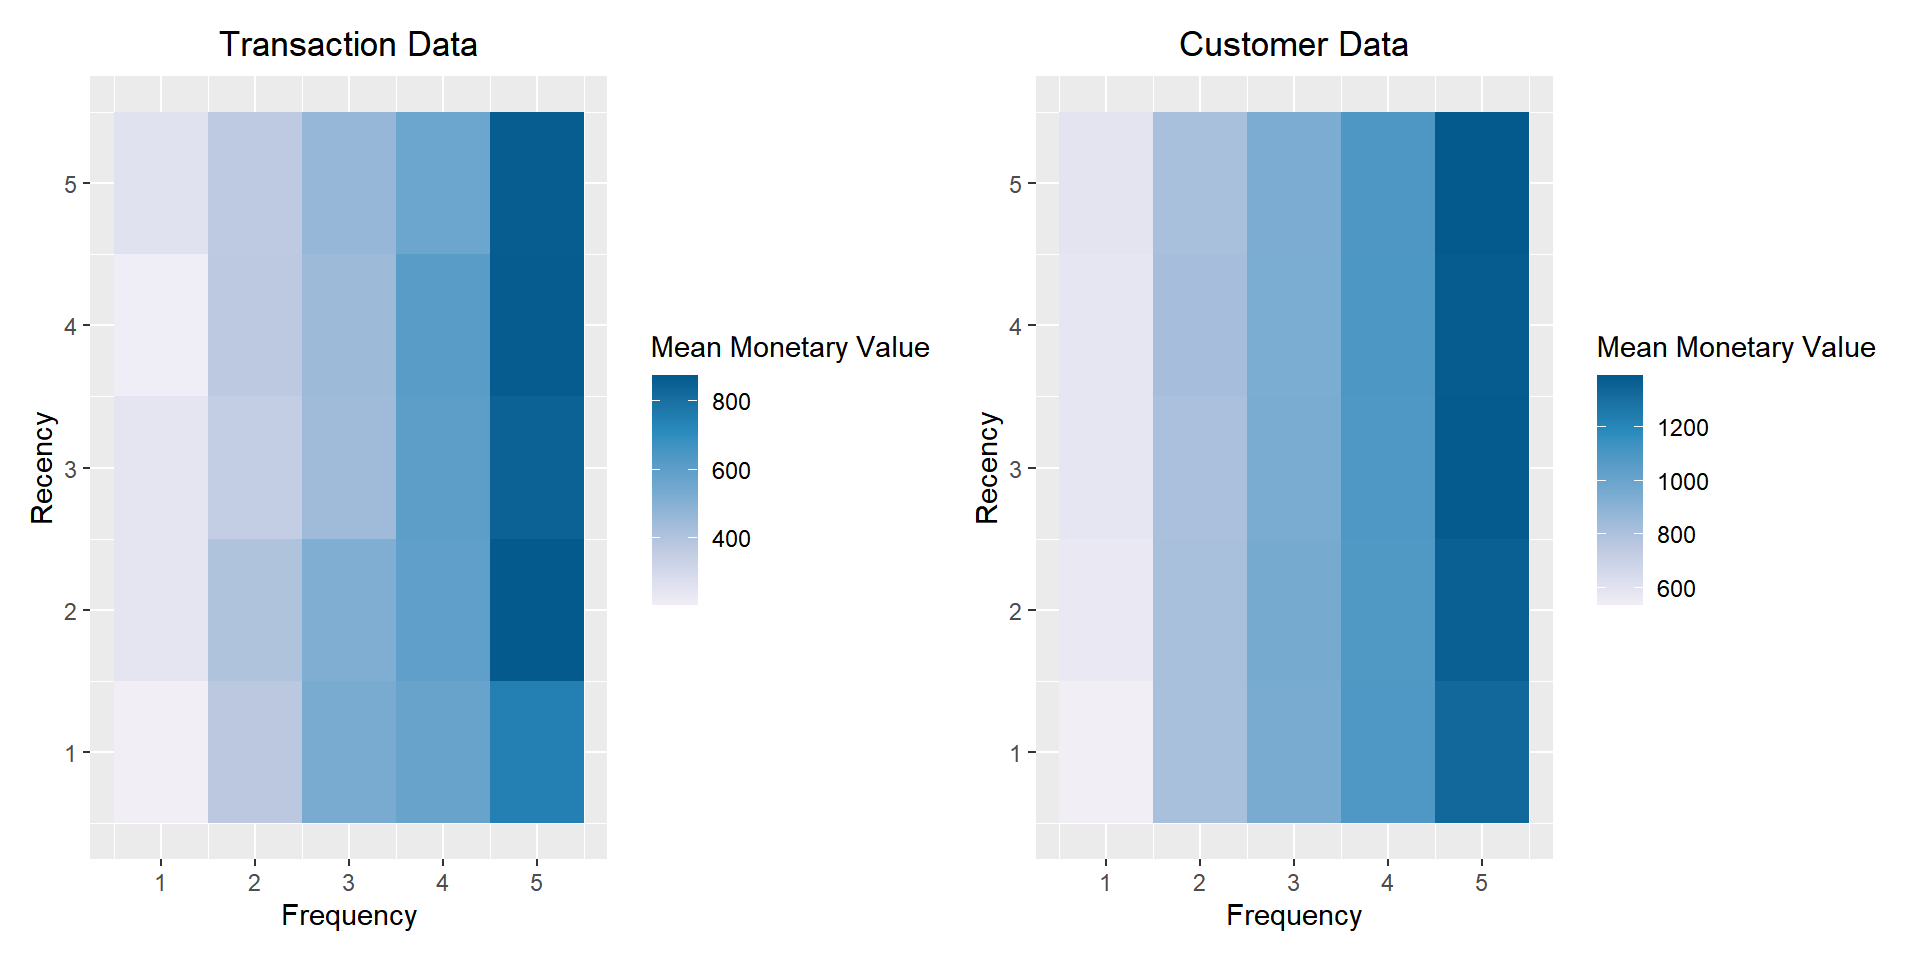
Custom Threshold for RFM Scores
Lots of users wanted to know the threshold used for generating the RFM scores. From version 0.2.1, rfm_table_* family of functions return the threshold.
analysis_date <- lubridate::as_date('2006-12-31')
result <- rfm_table_order(rfm_data_orders, customer_id, order_date,
                          revenue, analysis_date)

# threshold
result$threshold
# A tibble: 5 x 6
recency_lower recency_upper frequency_lower frequency_upper monetary_lower
<dbl> <dbl> <dbl> <dbl> <dbl>
1 1 115 1 4 12
2 115 181 4 5 256.
3 181 297. 5 6 382
4 297. 482 6 8 506.
5 482 977 8 15 666
# ... with 1 more variable: monetary_upper <dbl>Another request (see here) was to be able to use custom or user specific threshold for generating RFM score. rfm uses quantiles to generate the lower and upper thresholds used for generating the scores. Unfortunately, if the data is skewed, using quantiles is not effective. From version 0.2.1, users can specify custom threshold for generating the RFM score and we will learn how to do this using an example.
analysis_date <- lubridate::as_date('2006-12-31')
result <- rfm_table_order(rfm_data_orders, customer_id, order_date, revenue,
                          analysis_date)
result$threshold
# A tibble: 5 x 6
recency_lower recency_upper frequency_lower frequency_upper monetary_lower
<dbl> <dbl> <dbl> <dbl> <dbl>
1 1 115 1 4 12
2 115 181 4 5 256.
3 181 297. 5 6 382
4 297. 482 6 8 506.
5 482 977 8 15 666
# ... with 1 more variable: monetary_upper <dbl>If you look at the above output, we have 5 bins/scores and there are six different values. Let us focus on the monetary_* columns in the threshold table. The lower threshold of the first bin and the upper threshold of the last bin are the min and max values form the revenue column of rfm_data_orders and the rest of the values are returned by the quantile() function.
revenue <-
  rfm_data_orders %>%
  group_by(customer_id) %>%
  summarize(total = sum(revenue))

# revenue at customer level
revenue
# A tibble: 995 × 2
customer_id total
<chr> <int>
1 Abbey O'Reilly 472
2 Add Senger 340
3 Aden Lesch 405
4 Aden Murphy 596
5 Admiral Senger 448
6 Agness O'Keefe 843
7 Aileen Barton 763
8 Ailene Hermann 699
9 Aiyanna Bruen 157
10 Akeelah Walsh 779
# ℹ 985 more rows# min and max
min(revenue$total)[1] 12max(revenue$total)[1] 1488Let us look at the quantiles used for generating the scores.
quantile(revenue$total, probs = seq(0, 1, length.out = 6)) 0% 20% 40% 60% 80% 100%
12.0 254.8 381.0 505.4 665.0 1488.0 The intervals are created in the below style:
Left-closed, right-open: [ a , b ) = { x ∣ a ≤ x < b }
Since rfm uses left closed intervals to generate the scores, we add 1 to all values except the minimum value. Now, let us recreate the RFM scores using custom threshold instead of quantiles.
rfm_table_order(rfm_data_orders,
                customer_id,
                order_date,
                revenue,
                analysis_date,
                recency_bins = c(115, 181, 297, 482),
                frequency_bins = c(4, 5, 6, 8),
                monetary_bins = c(256, 382, 506, 666))
# A tibble: 995 x 9
customer_id date_most_recent recency_days transaction_cou~ amount
<chr> <date> <dbl> <dbl> <dbl>
1 Abbey O'Re~ 2006-06-09 205 6 472
2 Add Senger 2006-08-13 140 3 340
3 Aden Lesch~ 2006-06-20 194 4 405
4 Admiral Se~ 2006-08-21 132 5 448
5 Agness O'K~ 2006-10-02 90 9 843
6 Aileen Bar~ 2006-10-08 84 9 763
7 Ailene Her~ 2006-03-25 281 8 699
8 Aiyanna Br~ 2006-04-29 246 4 157
9 Ala Schmid~ 2006-01-16 349 3 363
10 Alannah Bo~ 2005-04-21 619 4 196
# ... with 985 more rows, and 4 more variables: recency_score <int>,
# frequency_score <int>, monetary_score <int>, rfm_score <dbl>We have used the values from the threshold table to reproduce the earlier result. If you observe carefully, we have specified 4 values while generating 5 bins/scores. Whenever using custom threshold, values supplied should be one less than the number of bins/scores generated as rfm internally computes the min and max values. In general, if you have n bins/scores, you only specify the upper threshold for n - 1 bins/scores.
We have tried our best to explain how to use custom threshold but completely understand that it can be confusing to implement at beginning. If you have any questions about this method, feel free to write to us at support@rsquaredacademy.com and our team will be happy to help you.
Acknowledgements
We are grateful to @leungi, @gfagherazzi and @DavidGarciaEstaun for their inputs.